

As rate cuts begin, here are the key economic trends to watch heading into 2025
The third quarter of 2024 is now complete and we are rapidly approaching the end of the year. Many of the economic themes that were prevalent in the third quarter — such as solid GDP growth, falling inflation, low housing inventory alongside high housing prices, and the exuberance over artificial intelligence — have been in place for at least a few years.
There were, however, some economic or market-related data that changed course or started a new trend in the third quarter, such as a softening in labor markets, a steepening of the yield curve and a broadening out of performance in equity markets.
In this environment, the big question is whether the Federal Reserve can engineer a “soft landing” for the economy, where inflation returns to 2% but the economy avoids a recession, a task it has successfully navigated so far. The Fed’s continued success will depend on several factors, many of which are still showing positive signs, though some are concerning and bear watching.
The rate cutting cycle has begun
The most anticipated event during the third quarter was the meeting of the Federal Reserve’s Open Market Committee in mid-September. While almost everyone was anticipating a rate cut, as it had been well telegraphed by most Federal Reserve governors, the size of the cut was uncertain all the way up until the conclusion of the meeting.
The FOMC’s “dot plot” shows the committee’s rate projections (data as of the Fed's September meeting)1
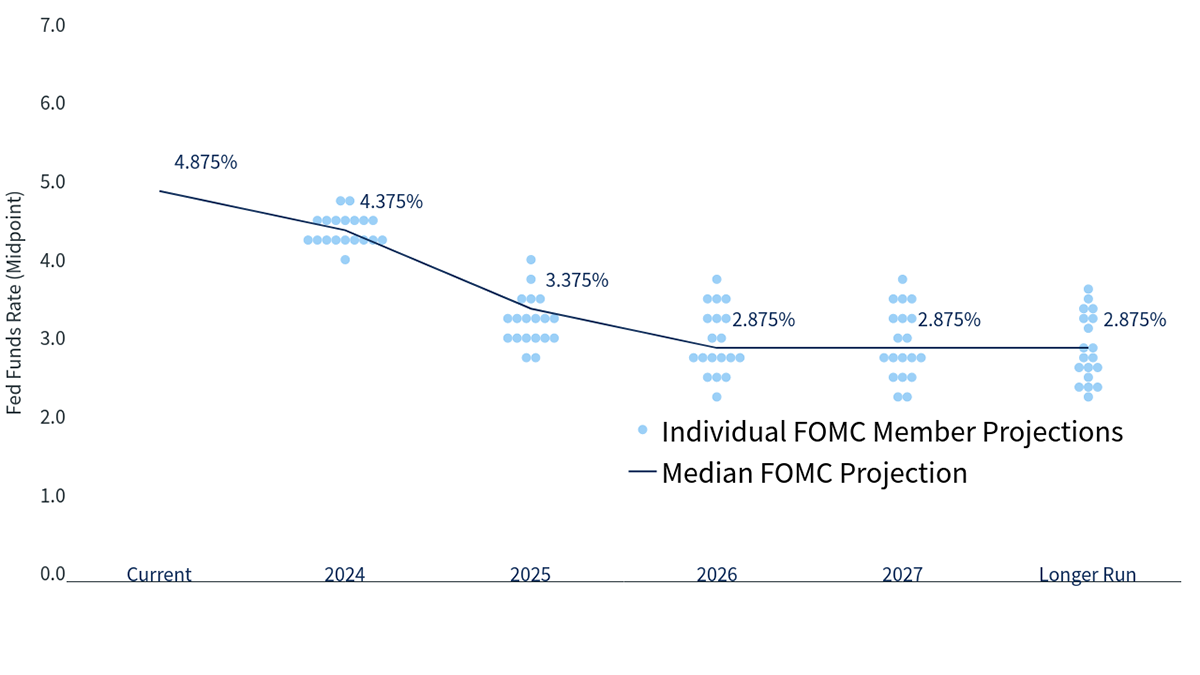
In the end, the Fed decided to go with a bigger cut of 0.50%, instead of the more typical 0.25% cut. Earlier this year, the Fed had pivoted from being more worried about inflation than the economy to being more balanced in its concerns between the two. The recent softening in labor markets, coupled with inflation falling below 3%, led the Fed to go with a bigger cut. This does not mean the Fed is overly worried about an impending recession in the near term, but is more a sign that interest rates were well above where they needed to be if the risks of inflation and recession are balanced.
This was the first time the Federal Reserve cut rates in almost four years, the second longest span since the early 1970s, surpassed only by the period from 2008-2019. The Fed was not alone in cutting rates, as the Bank of England, the European Central Bank, the Bank of Canada and many other global central banks cut rates at least once, and in many cases two or three times, in the past few months. It is widely expected that the Fed and other central banks will continue their easing cycle for many months in a methodical fashion, unless inflation surprisingly spikes again. A lower fed funds rate will reduce the interest people earn on cash, which over the past couple years has helped support consumer spending. However, it will also reduce borrowing costs for any loan that is based on a short-term rate.
The yield curve has un-inverted for first time in two years
Based on the dot plot that was released alongside the rate cut, Fed officials project a median fed funds rate of 3.25-3.5% by the end of 2025, indicating six more cuts over the next 15 months, assuming each one is 0.25%. Given the rate cut in mid-September and the expectation of more cuts in the near future, the yields on Treasury bonds fell during the quarter and are down substantially year over year. The 10-year yield has fallen 80 basis points (0.80%) since the end of the third quarter one year ago, and much of this occurred in the third quarter of 2024 as the expectations of a rate cut became stronger. The two-year yield fell by about twice as much over the past year — almost 1.40% — including a drop of about 1% in the third quarter alone.
The yield curve has shifted downward and un-inverted in recent weeks1
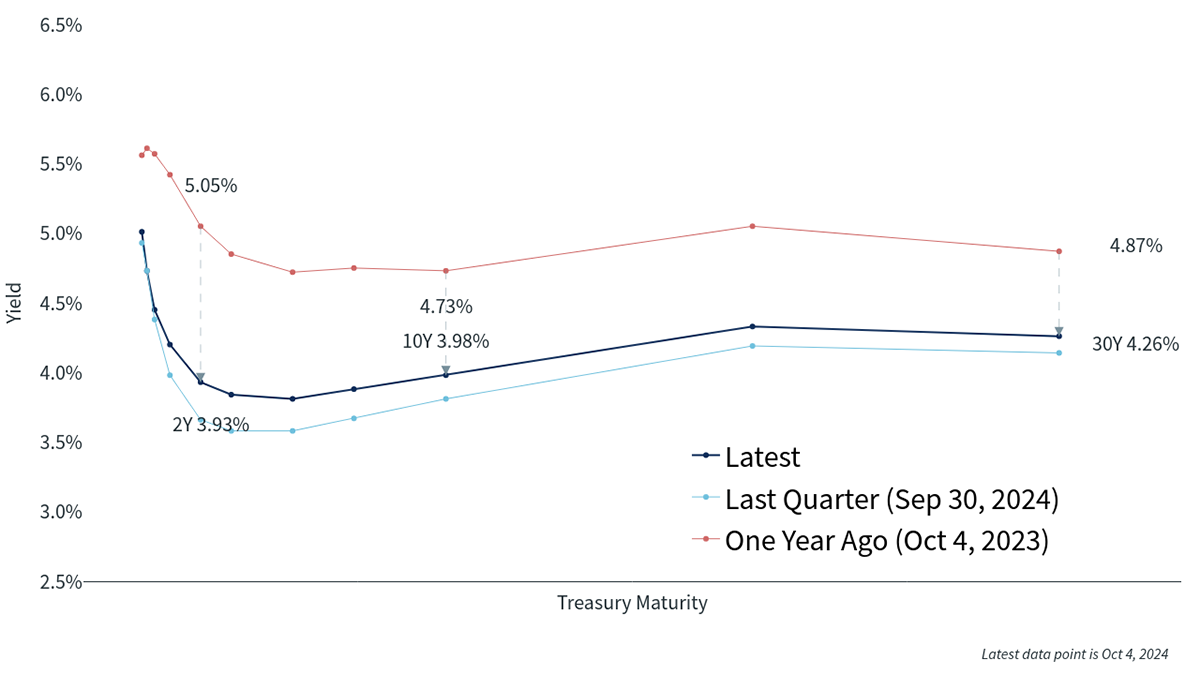
As a result of the more significant fall in short-term rates relative to longer-term rates, the two-year yield fell below the 10-year yield toward the end of the third quarter, which meant the yield curve was no longer inverted. This is the first time the curve has not been inverted since early in the third quarter of 2022, the longest period of inversion on record.
In the past, yield curve inversions usually precede recessions, as lower longer-term rates indicate an expectation that the Fed will cut rates due to a slowdown in economic activity. A recession has not yet happened during this cycle, partly because the period after the pandemic was so unusual relative to history, as consumers went into the rate-hiking cycle with more net worth and more savings than they have in the past, mostly due to the enormous amounts of fiscal stimulus that occurred during the pandemic.
It is important to remember that just because cash rates are expected to go lower does not automatically mean longer-term rates will follow. In fact, it is possible intermediate rates may not fall much at all from here, as much of the expected fall in the fed funds rate is already priced into the current 10-year Treasury yield. If intermediate-term rates do not fall, this could prevent mortgage rates, car loan rates and the interest on other debt from falling much more, even if the Fed continues to cut rates. This could forestall a much-hoped-for resurgence in housing markets and could cause delinquencies on debt that is tied to intermediate-term rates to rise.
GDP growth still solid, despite high interest rates
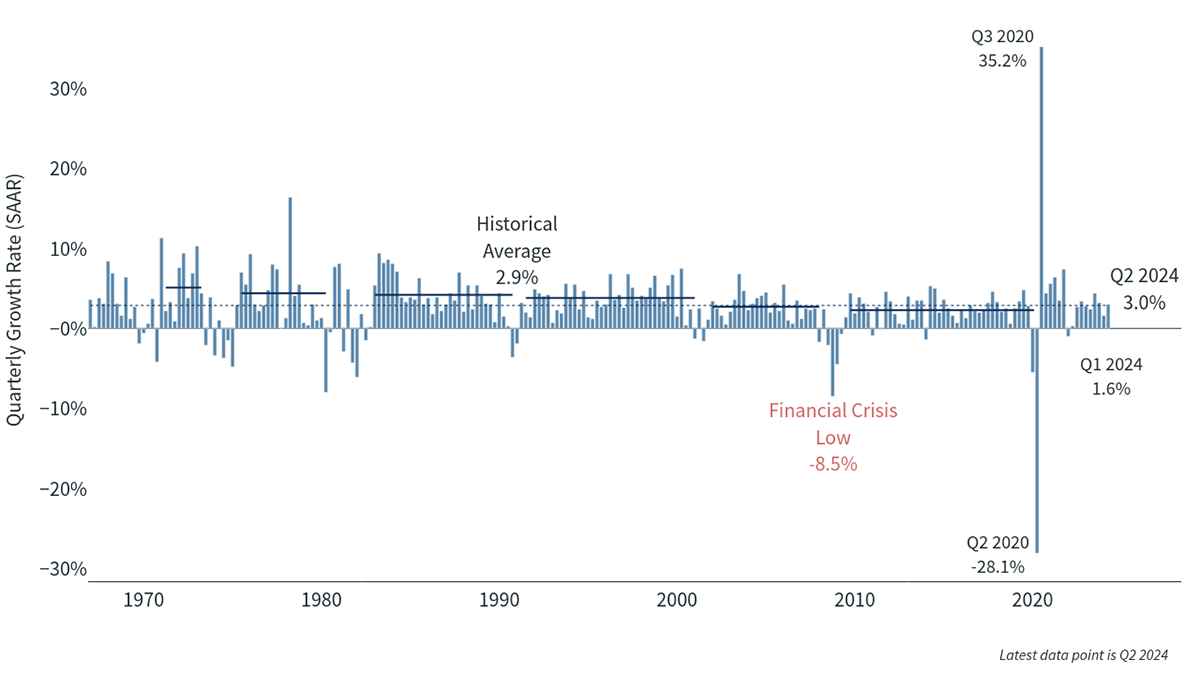
One of the more remarkable achievements for the U.S. economy over the past two years has been the strength of GDP growth in the face of rapidly rising short-term interest rates. Second quarter GDP was over 3%, based on the final revision released in September, continuing a trend of solid growth in GDP. Personal consumption was one of the main sources of support for GDP growth, as consumer spending has not yet pulled back in a meaningful way. The current forecast for third quarter GDP, which will officially be released on October 26, is also close to 3%, and even the fourth quarter of 2024 looks to be around 2% or more.
GDP remains healthy and Q2 growth has been revised up2
Inflation also continued to fall in the third quarter, another positive economic sign. The consumer price index (CPI) is down to 2.5%, and core CPI hit its lowest level since 2022. Other measures of inflation, including the Fed’s preferred gauge, the personal consumption expenditures (PCE) index, are almost all below 3% and falling. If rents and insurance are stripped out, inflation is very close to 2%. This is true globally as well; inflation in Europe is down to 2%, and in Canada inflation is similar to the U.S.
Economic growth is strong, inflation is under control and short-term rates have started to fall, which is all good news. What is the bad news? Two areas of concern are payroll growth, which is slowing, and consumer debt and delinquencies, which are rising.
Payroll growth is slowing to more normal levels
While payrolls are still growing, the rate of growth has slowed considerably from the peak in 2022 and 2023. Prior to the September report, which was announced right after quarter end on October 4, the data released in the third quarter showed payroll growth of about 125,000 jobs, down from over 200,000 per month in 2023. Not only that, but job growth from early 2023 to early 2024 was reduced by over 800,000 jobs in revised numbers that came out in July, causing many to worry that the labor market was weakening faster than anyone thought.
Unemployment remains historically low3

On the other hand, wage growth remains around 4%, which is a level that is in line with 2% inflation if productivity can remain at or above 2%. The unemployment rate is only 4.1%, which is up from the low of 3.4% set in January 2023, but well below the 50-year average of over 6%. Weekly jobless claims remain low and are well below the levels that would indicate a labor market crisis, and job openings, hiring activity and the quits rate are all at normal levels relative to the size of the workforce. Finally, the payroll report for September trounced expectations, with an increase of over 250,000 jobs and positive revisions to the prior two months. The labor market may not be as strong as it was in 2023, but it is still solid enough to produce positive GDP growth and consumer spending.
Delinquencies and consumer debt levels are rising
The other area of concern is the increase in consumer debt and delinquencies that have occurred in a few pockets of consumer lending. Overall U.S. consumer borrowing increased $25 billion in July, the highest jump since November 2022, as many individuals have spent the excess savings accumulated during the pandemic. Both revolving debt, such as credit cards, and non-revolving debt, such as car and student loans, increased over $10 billion in the month.
Delinquencies are also rising. Through the second quarter, 8% of auto loans were 30 or more days delinquent, the highest level since the fourth quarter of 2010. Credit card delinquencies surpassed 9%, the highest level since 2011. Not only are consumer delinquencies rising, but almost 2,500 companies filed for bankruptcy in the second quarter of 2024. That is double the amount from the second quarter of 2022 and the highest reading since 2012, when the economy was still emerging from the great financial crisis of 2008-2009.
Most consumers still have more wealth than when the pandemic started and are seeing wage growth above inflation. The savings rate is currently low but has been volatile month to month. Credit growth and delinquency are somewhat high, which could prove troublesome in the future and bears watching, but the levels are not yet to a point that could cause severe economic harm.
Despite rise in volatility, equities continue to appreciate
Due to the mixed economic signals, volatility returned to equity markets in the third quarter. Despite this renewed volatility, almost every area of the equity market ended the quarter with positive quarterly performance as well as robust returns year to date. The S&P 500 finished the quarter up 22% year to date, mid-cap stocks were up almost 15% and small-caps were up 11% since December 31. International developed stocks were up about 13% and emerging markets were up almost 17%. Growth continued to outperform value for the year, up 28% versus 15% in large-cap.
The S&P 500 has generated strong total returns this year despite volatility4
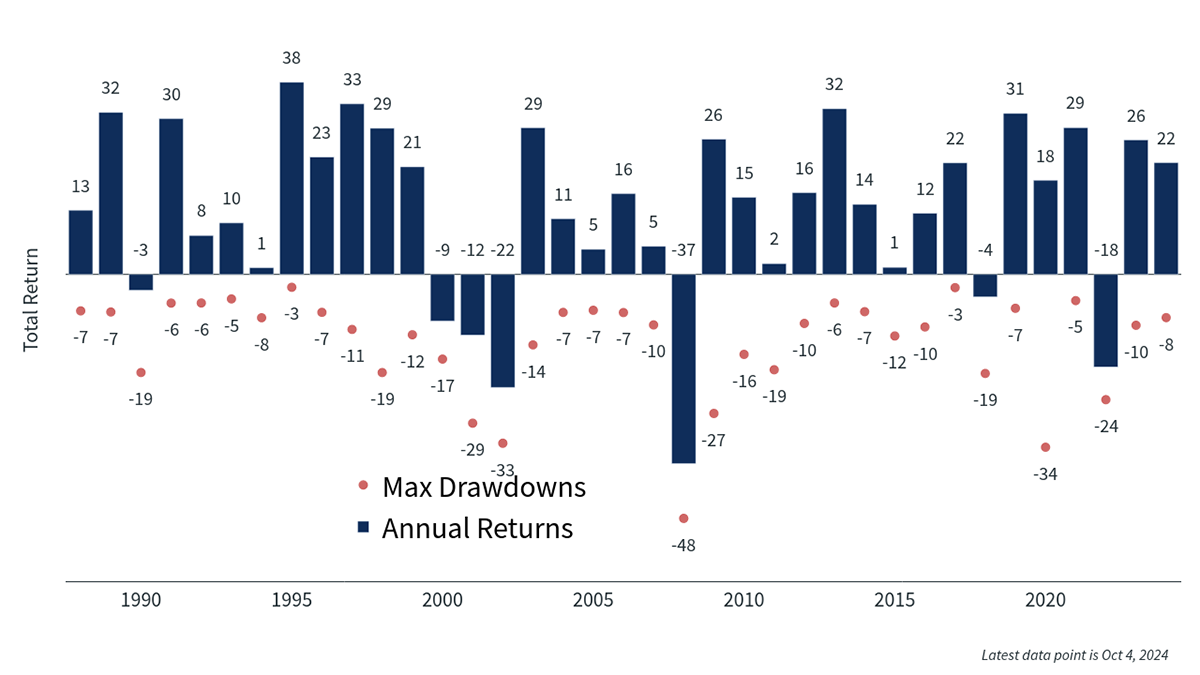
As an example of the market volatility, the first week of September was the worst start to a September for the S&P 500 in many decades, down over 4%, but by the end of September the index was up 2% for the month and up 22% for the year. Nvidia, the largest market cap in the index and the company that has most benefited from the fanfare around AI, had the largest single-day increase in market cap in history on July 31 when it gained over $300 billion. It also had the single largest decline in market cap in history on September 3, when it fell roughly $280 billion.
Besides the return of volatility after a fairly benign second quarter, another change that occurred during the quarter was that returns were not dominated by U.S. large-cap stocks. Large-cap stocks lead for the year, as year to date the S&P 500 is up over 22% through September 30, doubling the return of the small-cap focused Russell 2000, which is up 11%. During the third quarter, however, the Russell 2000 beat the S&P 500 quite handily, as the former was up over 9% and the latter was up just under 6%. Value also outperformed growth, with large-cap value rising 9% and growth rising under 4%. It is too early to say if this is a long-lasting change in leadership, but if the economy can avoid a recession and short-term rates continue to fall, it could provide a tailwind to small-cap and value stocks.
Stay the course with a long-term plan
It is hard to believe the Fed finished its rate-hiking campaign just over a year ago, in July 2023. It took 14 months to finally enter the rate-cutting phase. Despite solid GDP growth and inflation that has yet to reach 2%, the Fed has the flexibility to cut as current rate levels are fairly restrictive, and rate cuts should help the economy sustain positive growth for the foreseeable future. There are certainly a few risks to economic growth that the Fed cannot fully control — geopolitical issues in eastern Europe and the Middle East, large federal budget deficits, industrial action by unions and increased delinquencies on debt repayments, just to name a few. On a positive note, payrolls are still growing, corporate earnings are rising, wages are increasing at a sustainable pace and core inflation is almost back to 2%, leading to real wage gains for the average U.S. worker. Short-term interest rates are beginning to fall, which should eventually help the economy, and mortgage activity is beginning to pick up, though from very low levels.
Much can change in markets in a short period of time, and while individual days can be volatile, it is best to focus on long-term trends and not get caught up in the excitement or fear generated by each data point. Most often, the prudent course of action is to stick to a long-term investing plan and take steps that can help lead to a better risk-adjusted return, including rebalancing portfolios at regular intervals, using losses to offset capital gains incurred from selling securities, and reviewing financial plans on a regular basis. Taking these actions can help you stay the course during periods of volatility and can lead to better outcomes over longer periods of time.
The views and opinions represented in this message are my own and do not necessarily reflect the perspective of Bremer Bank, its subsidiaries or affiliates, or its employees. This message is provided for information purposes only and nothing in it constitutes investment, legal, accounting or tax advice, or a recommendation to buy, sell or hold any security. No recommendation or advice is being given as to whether any investment or strategy is suitable for a particular investor.
%20--%3e%3cg%3e%3cg%20id='Layer_1'%3e%3cpath%20class='cls-1'%20d='M63,35.91c.05,14.91-12.02,27.03-26.99,27.12-14.79.09-26.95-12.03-27.01-26.91-.06-15.01,11.91-27.11,26.87-27.16,14.95-.05,27.08,12,27.13,26.95ZM45.08,18.32c-2.37,0-4.6-.07-6.82.02-3.32.14-5.55,1.94-6.61,5-.51,1.46-.62,3.07-.75,4.63-.12,1.45-.03,2.91-.03,4.54h-6.14v6.98h6.16v16.82h7.5v-16.89c1.6,0,2.98.05,4.34-.03.4-.02,1.05-.36,1.11-.65.4-2.02.67-4.06,1.01-6.3h-6.51c0-1.55,0-2.92,0-4.29,0-2.53,1.12-3.72,3.67-3.83,1-.05,2,0,3.06,0v-5.97Z'/%3e%3c/g%3e%3c/g%3e%3c/svg%3e)
%20--%3e%3cg%3e%3cg%20id='Layer_1'%3e%3cpath%20class='cls-1'%20d='M63,36.15c-.07,14.97-12.18,26.99-27.11,26.89-14.9-.1-26.92-12.16-26.89-26.99.03-15.01,12.15-27.11,27.15-27.08,14.87.03,26.92,12.23,26.85,27.18ZM36.62,51c.03-.53.08-.98.08-1.42,0-3.11-.04-6.22.02-9.33.05-2.49,1.88-4.31,4.23-4.36,2.31-.05,3.92,1.63,4,4.27.06,1.88.02,3.77.02,5.66,0,1.72,0,3.43,0,5.17h6.01c0-5.04.18-9.98-.07-14.91-.16-3.17-3.26-5.57-6.55-5.78-2.85-.18-5.44.35-7.56,2.83-.08-1.07-.14-1.75-.19-2.46h-5.83v20.33h5.84ZM27.06,30.66h-5.99v20.32h5.99v-20.32ZM24.06,20.18c-2.03-.03-3.64,1.57-3.66,3.65-.02,2.14,1.45,3.73,3.52,3.78,2,.05,3.74-1.57,3.82-3.56.08-2.04-1.63-3.84-3.68-3.87Z'/%3e%3c/g%3e%3c/g%3e%3c/svg%3e)
%20--%3e%3cg%3e%3cg%20id='Layer_1'%3e%3cg%3e%3cpath%20class='cls-1'%20d='M35.95,9.01c14.89-.05,27.01,12,27.05,26.9.04,14.88-12.08,27.09-26.9,27.08-14.88,0-27.08-12.13-27.1-26.93-.02-14.85,12.08-27,26.95-27.05ZM36.02,18.76c-2.54,0-5.09-.01-7.63,0-5.58.03-9.63,4.08-9.65,9.64-.01,5.09-.02,10.18,0,15.27.02,5.3,3.98,9.46,9.28,9.57,5.34.11,10.69.11,16.03,0,5.31-.11,9.22-4.26,9.24-9.58.02-5.19.03-10.38,0-15.57-.04-5.2-4.12-9.25-9.33-9.31-2.65-.03-5.29,0-7.94,0Z'/%3e%3cpath%20class='cls-1'%20d='M50.22,36.02c0,2.54.02,5.09,0,7.63-.03,3.73-2.68,6.49-6.41,6.54-5.19.06-10.37.06-15.56,0-3.7-.04-6.42-2.81-6.45-6.52-.04-5.14-.04-10.27,0-15.41.03-3.64,2.72-6.38,6.36-6.42,5.24-.06,10.48-.06,15.71,0,3.67.04,6.31,2.75,6.35,6.41.03,2.59,0,5.19,0,7.78ZM36.1,26.6c-5.11-.05-9.38,4.12-9.43,9.2-.05,5.28,4.02,9.53,9.18,9.59,5.26.07,9.54-4.07,9.66-9.35.11-5.02-4.25-9.4-9.41-9.44ZM43.25,26.81c.02,1.05,1.05,2.03,2.08,1.99,1.07-.04,2.04-1.06,1.92-2.12-.12-1.15-.78-1.84-1.98-1.87-1.13-.03-2.05.89-2.02,1.99Z'/%3e%3cpath%20class='cls-1'%20d='M42.2,36.07c-.04,3.39-2.95,6.22-6.3,6.13-3.35-.09-6.06-2.89-6.05-6.23,0-3.28,2.86-6.13,6.15-6.14,3.36,0,6.24,2.89,6.2,6.24Z'/%3e%3c/g%3e%3c/g%3e%3c/g%3e%3c/svg%3e)
%20--%3e%3cg%3e%3cg%20id='Layer_1'%3e%3cg%3e%3cpath%20class='cls-1'%20d='M8.99,36.02c0-14.9,12.03-27.02,26.87-27.06,14.99-.03,27.2,12.17,27.15,27.13-.05,14.95-12.18,26.99-27.14,26.94-14.9-.05-26.87-12.08-26.87-27.02ZM36,48.01c4.01-.29,8.03-.5,12.03-.89,2.54-.25,3.77-1.45,4.16-3.94.75-4.76.75-9.54.02-14.3-.39-2.56-1.67-3.79-4.23-4.08-7.98-.91-15.96-.92-23.94,0-2.67.31-4.16,1.68-4.27,4.36-.18,4.57-.17,9.15,0,13.71.1,2.6,1.56,3.98,4.19,4.24,4,.4,8.01.6,12.04.89Z'/%3e%3cpath%20class='cls-1'%20d='M41.32,35.97c-2.91,1.7-5.64,3.29-8.55,4.98v-9.87c2.87,1.64,5.61,3.21,8.55,4.89Z'/%3e%3c/g%3e%3c/g%3e%3c/g%3e%3c/svg%3e)