After four years of economic uncertainty, mid-2024 looks more stable
We’ve passed the halfway point of 2024, and while there are still plenty of days left in the year, the economic data and market returns so far have proven to be fairly steady after four years of volatility, surprises and uncertainty.
Inflation has recently resumed falling and is ever closer to the Federal Reserve’s 2% target, stock volatility is extremely low and even bond yields have settled down a bit. GDP growth remains positive, and while labor market strength has come down from its post-pandemic high, it is still at or above where it was before the pandemic.
As we look to the second half of the year, it is worth considering what might cause the lower level of volatility in equity and fixed-income markets as well as economic data to change.
Stocks had a great start to 2024
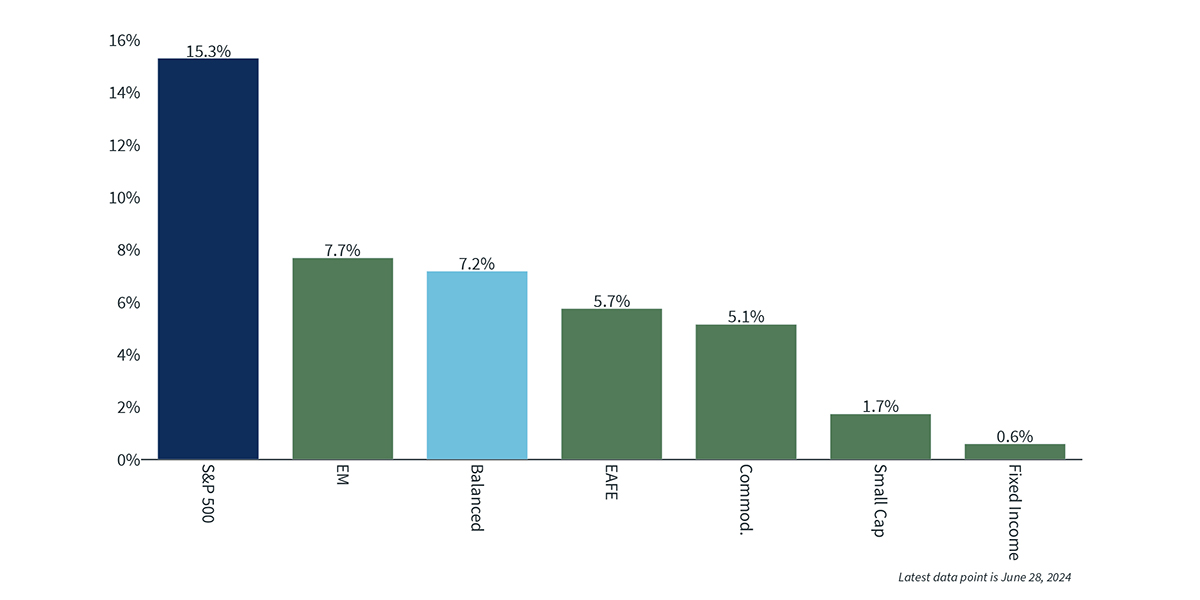
The first half of the year saw strong returns for stocks, especially U.S. large cap, continuing a decade of positive equity performance. The S&P 500 index finished the first half of 2024 up 15.3%, an incredibly hot start to the year, and set over 30 record highs along the way. Looking further back, the S&P 500 has returned 24% over the past year, which is well above historical averages. The trailing five-year annualized return is roughly 15% and the trailing 10-year annualized return is just under 13%, both also above the historical average for the S&P.
Not every area of equity markets produced such stellar returns. U.S. midcaps were up just under 5% in the first half of 2024, international developed equities returned just over 5% and U.S. small caps brought up the rear, with a modest 1.7% return.
Even within the S&P 500, there was a huge disparity between the winners and the rest of the index. Just a few of the largest names drove almost all of the performance, especially Nvidia, which was up 150%. In fact, the average S&P 500 stock was only up 4% in the first half of the year, not terribly different than U.S. midcap or international developed results. As the biggest names continue to have the best performances, the S&P 500 index has become very concentrated, with the 20 largest names accounting for over half of the index’s weight. That is a higher percentage than even in the dot-com bubble.
Will the impressive run of large cap technology stocks, especially artificial intelligence-related names, continue? Despite the rapid price appreciation, earnings growth remains solid, so valuations have not risen as fast as prices. Artificial intelligence could prove to be a boon to productivity, allowing for wage and profit growth at the same time, justifying higher prices. On the other hand, much is unknown about how AI will affect the economy, and whether companies will be able to sustainably profit from it. The price-to-sales ratio of the S&P 500 technology sector rose to almost 10 in June, one of its highest levels ever and triple the average ratio since 1990, exceeding even the levels it reached during the dot-com bubble. Other valuation numbers also looked stretched, so while momentum can continue for a while, it is unlikely the S&P can maintain these kinds of returns without significant earnings growth. With profit margins already near historic highs and the economy slowing, it is hard to see how that will happen for the index overall. If the Fed does cut interest rates, it could prove to be a tailwind for equities, especially cheaper areas of the market, such as U.S. small caps and international markets.
Asset class returns in the first half of 20241

Bonds continue to lag but yields look attractive
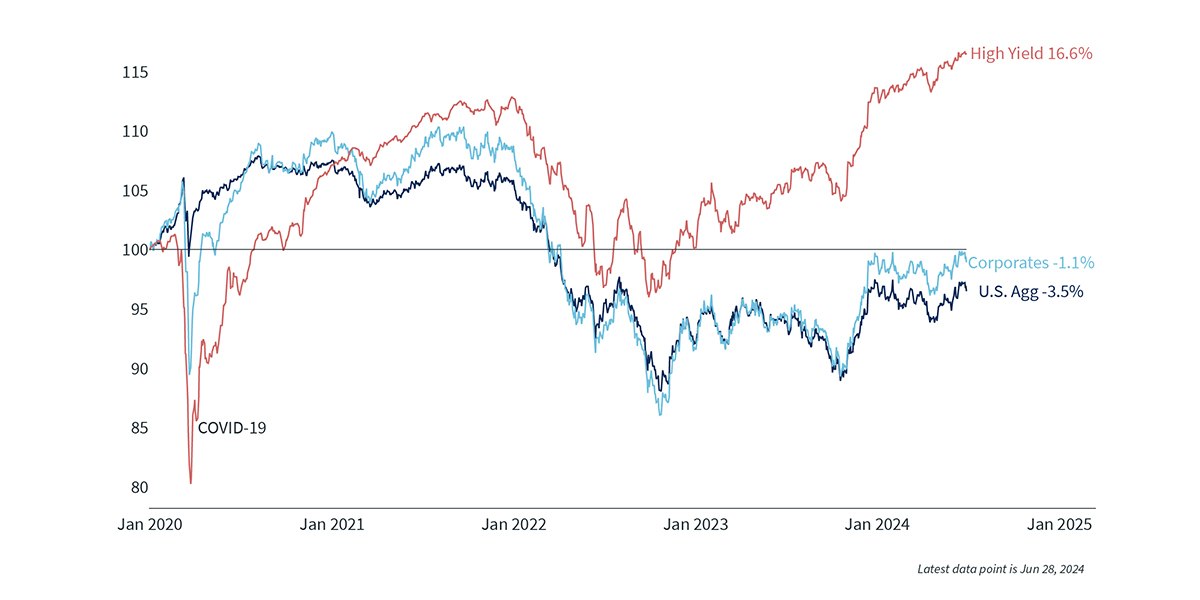
The last three years have been difficult for bond investors, especially when compared to the robust returns in the stock market. The Bloomberg Aggregate Bond Index has returned -3% annualized over the past three years, one of its worst returns in history. Investment-grade bonds continued to weaken in the first half of this year, finishing the first six months of 2024 down 0.7%. Even over longer periods, the picture does not look good. The total return for the Bloomberg Aggregate is slightly negative out to five years, losing out to cash, and sits at a meager 1.4% annualized for 10 years, well below the S&P 500’s 12.9% annualized return over the same time period.
However, yields are much more attractive today than they have been in years, making it likely that forward returns will be much better than the past few years. Bond investors are also benefiting from a fall in volatility, which is almost back to long-run averages after spiking the past two years to levels last seen during the great financial crisis of 2007-2009.
Due both to the dreadful performance of intermediate and long-term investment-grade bonds and the fact that shorter-term yields have been higher than longer-term yields, many investors have pulled money from bonds the last few years and parked it in cash. The yield advantage of cash is smaller now, however. That’s because the yield curve, which has been inverted since July 2022 – the longest inversion on record – has steepened in 2024. The difference between the 10-year yield and two-year yield is down to 0.35%, near its low since the curve first inverted and well below the peak of over 1% that occurred last summer.
Barring an unexpected jump in inflation or a major slowdown in the world economy, yields on Treasury bonds are unlikely to fall much below 4% or rise much above 5%. Credit spreads on investment-grade corporate bonds are fairly tight, so a recession scare could cause those spreads to widen, but it does not appear a recession is on the horizon in 2024. Barring any unexpected news, it is likely that yields across much of the U.S. fixed-income market stay range bound for the rest of the year.
The biggest concern for U.S. Treasury yields, which drive yields on almost every other type of fixed-income security, are increasing federal debts. Interest payments paid on debt by the federal government hit a record annual rate of over $1 trillion in the first quarter of 2024, which is roughly double the $535 billion paid three years ago. So far, the market is not demanding a higher yield to compensate for the increasing supply of Treasuries that need to be issued to cover annual deficits. However, yields could jump at some point if the U.S. does not make an attempt to corral its spending or produce nominal growth that exceeds the average yield on the debt.
Major bond sector returns since 20202

Labor markets normalizing but still solid
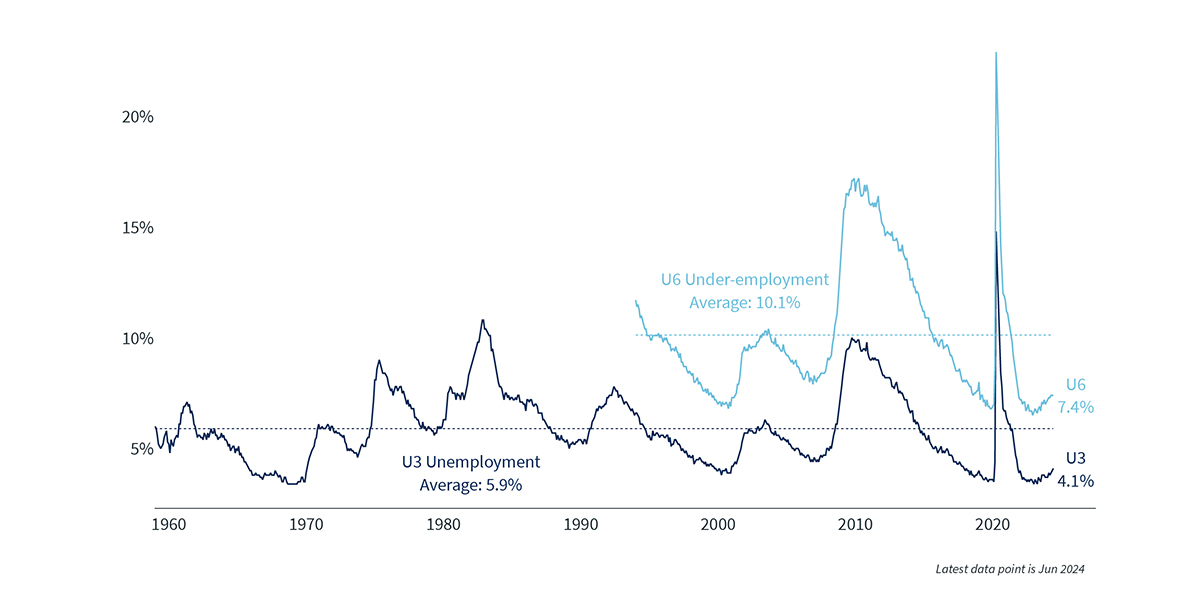
Almost all 2024 data related to labor markets show a softening from the peak but overall a still healthy environment for finding work. Unemployment has crept up to 4.1%, above the trough of 3.4% set in early 2023, but that figure is low relative to most of history. Job openings and quits are off their highs and are generally back to pre-pandemic levels, which was considered at the time to be a healthy labor market. Layoffs have been rising modestly but remain low overall, as the reduction in demand for labor has mostly come through a reduction in job openings, not outright job cuts — so far.
In other good news for employees, wage growth remains above inflation and payrolls are growing every month, with growth mainly coming from businesses that employ fewer than 50 people.
What is next for labor markets and GDP growth? As long as inflation continues declining and remains below wage growth, consumers shouldn’t have to cut back spending too much, which should keep GDP growth positive for at least a few more quarters. There will be cutbacks in some industries that either over hired or are taking advantage of AI to bring efficiencies, but this may be offset by hiring in hospitality, healthcare and other service industries. The risk is that low- to middle-income consumers start to pull back spending now that most excess savings are gone, which would hurt a lot of the small businesses that have been doing most of the hiring lately.
Unemployment3

Inflation is falling once again
Throughout much of early 2024, it appeared that inflation may have ceased falling and would be stuck above 2% for much longer than most people expected coming into the year, which would cause the Federal Reserve to maintain higher interest rates for a longer period of time. After remaining range bound early in the year, inflation thankfully resumed falling the last two months of the quarter, and by almost every measure is now at its lowest level in three years. The core consumer price index (CPI) is down to 3.4% and the component of CPI focused on goods prices is actually deflating. The personal consumption expenditures (PCE) index, which is the Federal Reserve’s preferred inflation gauge, fell to 2.6% in May, down from 4% one year earlier but still above the Fed’s 2% target. If it weren’t for the housing component of inflation, which is still running above 5%, overall inflation would be even closer to the target.
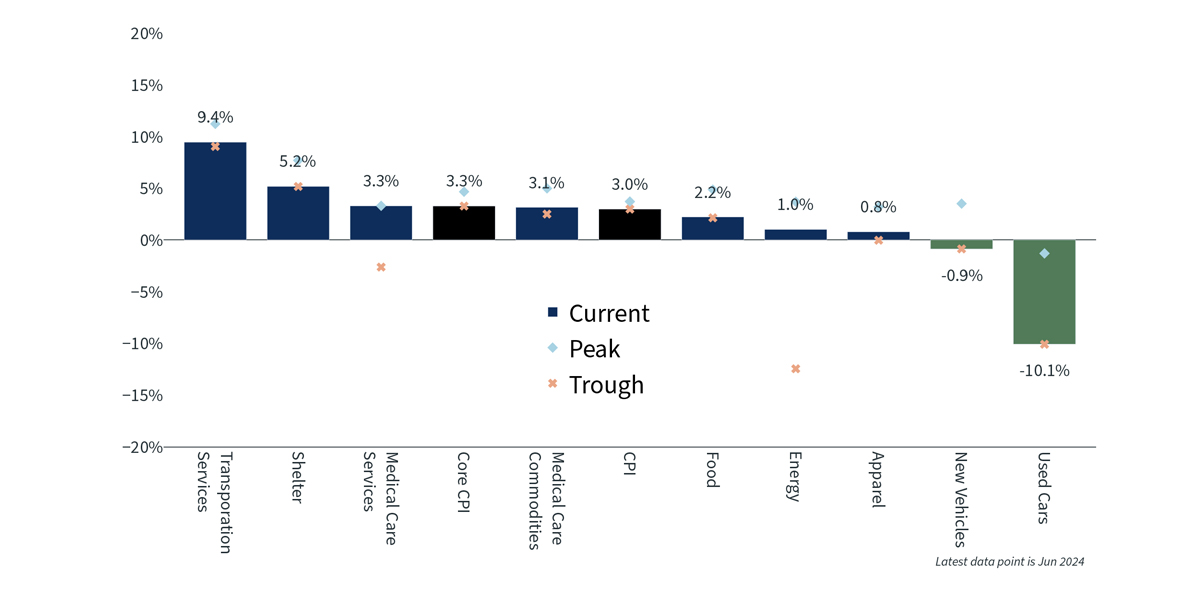
It is too early to assume that the battle is won, however. As the chart below demonstrates, many of the components of inflation are at their highest levels in the past 12 months, while others are at their lowest levels, making predictions about how fast inflation can fall difficult. The transportation services component has increased by more than 10% over the prior year, mostly due to large increases in auto insurance rates. Energy prices are up more than at any time in the past year, as are medical care services. On the other hand, while shelter has been the largest contributor to above-target inflation given its large weight in the index, it is now rising at a slower pace than in any month over the prior year.
A more balanced labor market will help alleviate pressure on inflation, as will slowly declining rents. But it may take some time for rents and housing prices to fall much from here given low supply and higher mortgage rates. With bonds producing higher yields, equities and home prices rising and even cash paying high returns, the wealth effect is helping sustain consumer spending, even though on average most people have spent their excess savings accumulated in the pandemic. In addition, wage growth is still above inflation, so it is probable that inflation will remain above 2% for the rest of 2024 and even into 2025 as demand for services and labor remains high.
Consumer price index components4

Rate cuts on the horizon
After a prolonged period of rapidly rising rates, it has now been a year since the last rate hike by the Federal Reserve Open Market Committee. The federal funds rate has been at the current 5.25-5.5% level since July 2023, and based on recent statements from Fed governors, it is likely to remain there for at least a couple more months. While the Fed has neither raised nor lowered rates in 12 months, some other large central banks, including the European Central Bank and the Bank of Canada, have now begun to cut rates, though by small amounts so far.
Looking ahead at short-term interest rates in the U.S., the Federal Reserve’s quarterly dot plot forecasts one rate cut in 2024, down from the three rate cuts predicted previously. At the start of 2024, markets expected the Fed to act much more swiftly in cutting rates than the Fed itself was suggesting, as markets had priced in roughly six cuts this year alone. After some stronger-than-expected growth and resilient inflation, at the end of the second quarter, markets are pricing in just one or two rate cuts in 2024, and only a 1-in-3 chance there will be four cuts by March 2025. That’s a big change from the start of the year and more in line with the Fed’s forecast.
Where do short-term interest rates head from here? It is likely most central banks will take a similar approach to reducing rates, slowly cutting by only 0.25% at a time while closely monitoring unemployment and inflation data, pausing along the way to ensure inflation doesn’t pick back up.
Fed feds rate and SEP projections5

Positive but mild growth ahead?
The economy has endured a lot over the past three years, including inflation, high short-term interest rates, geopolitical issues and bank failures. Despite all that, the U.S. economy has kept chugging along, producing everything from decent to extremely robust growth from quarter to quarter, defying odds of a major slowdown or a recession. Forecasts for the rest of 2024 indicate growth will be positive but mild, with a recession at least 6-12 months off. The reduced yield volatility and stable fed funds rate has also been a positive for the financial services sector.
At some point a recession will come, but it is almost impossible to predict precisely when. It is even harder to know exactly how markets will react if we appear to be headed into a recession. Volatility and uncertainty will also ebb and flow, but for most investors, the best way to handle the constant flow of ever-changing data is to build a diversified portfolio that aligns with your risk tolerance and cash flow needs, and focus on long-term goals.
The views and opinions represented in this message are my own and do not necessarily reflect the perspective of Bremer Bank, its subsidiaries or affiliates, or its employees. This message is provided for information purposes only and nothing in it constitutes investment, legal, accounting or tax advice, or a recommendation to buy, sell or hold any security. No recommendation or advice is being given as to whether any investment or strategy is suitable for a particular investor.
